This section of Arranging Director allows you to view from a selection of charts and graphs.
Navigate to Arranging Director > Reports > Charts & Graphs.
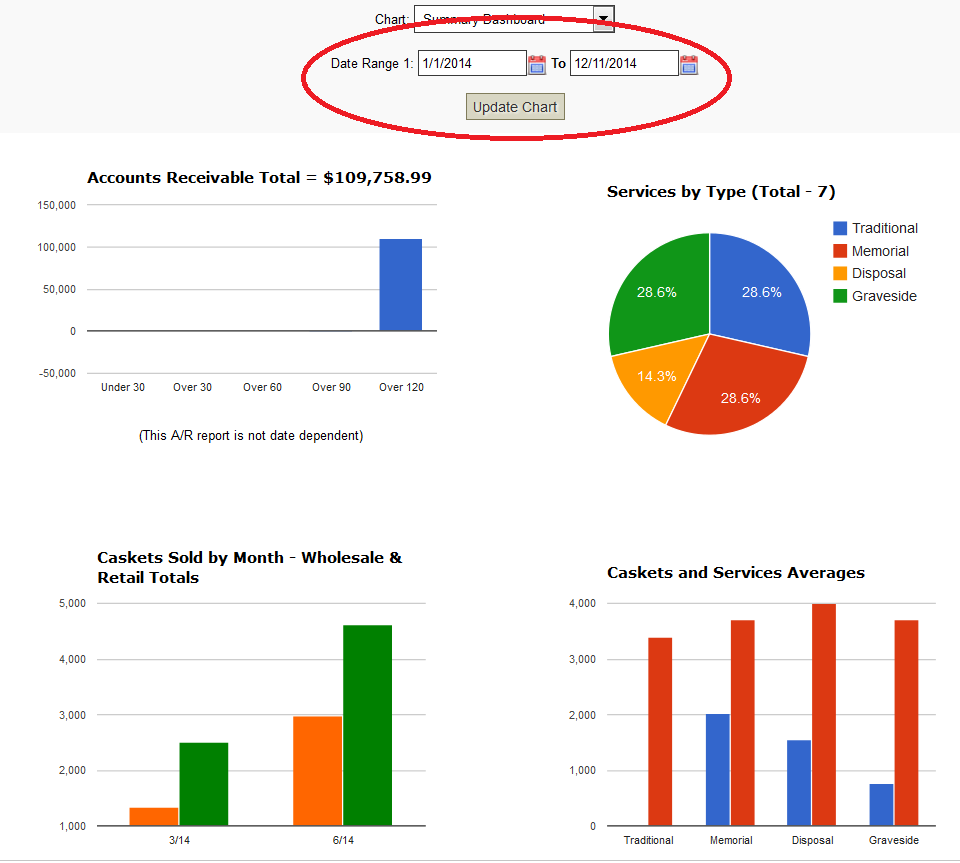
The first screen that appears is an overview screen. The dates default to the last twelve months. You may change the date range of the data by modifying the dates in the Date Range 1 fields and clicking ‘Update Chart’.
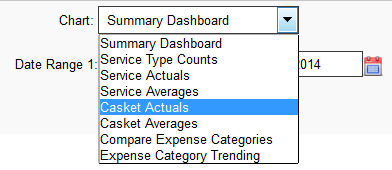
If you want to view another chart in the library simply choose another chart from the Chart dropdown.
You will have the ability to enter values for different fields depending upon what is required for a particular chart. If a chart compares values over two different date ranges you will be allowed to enter dates for both ranges.

Need more help with this?
Don’t hesitate to contact us here.


